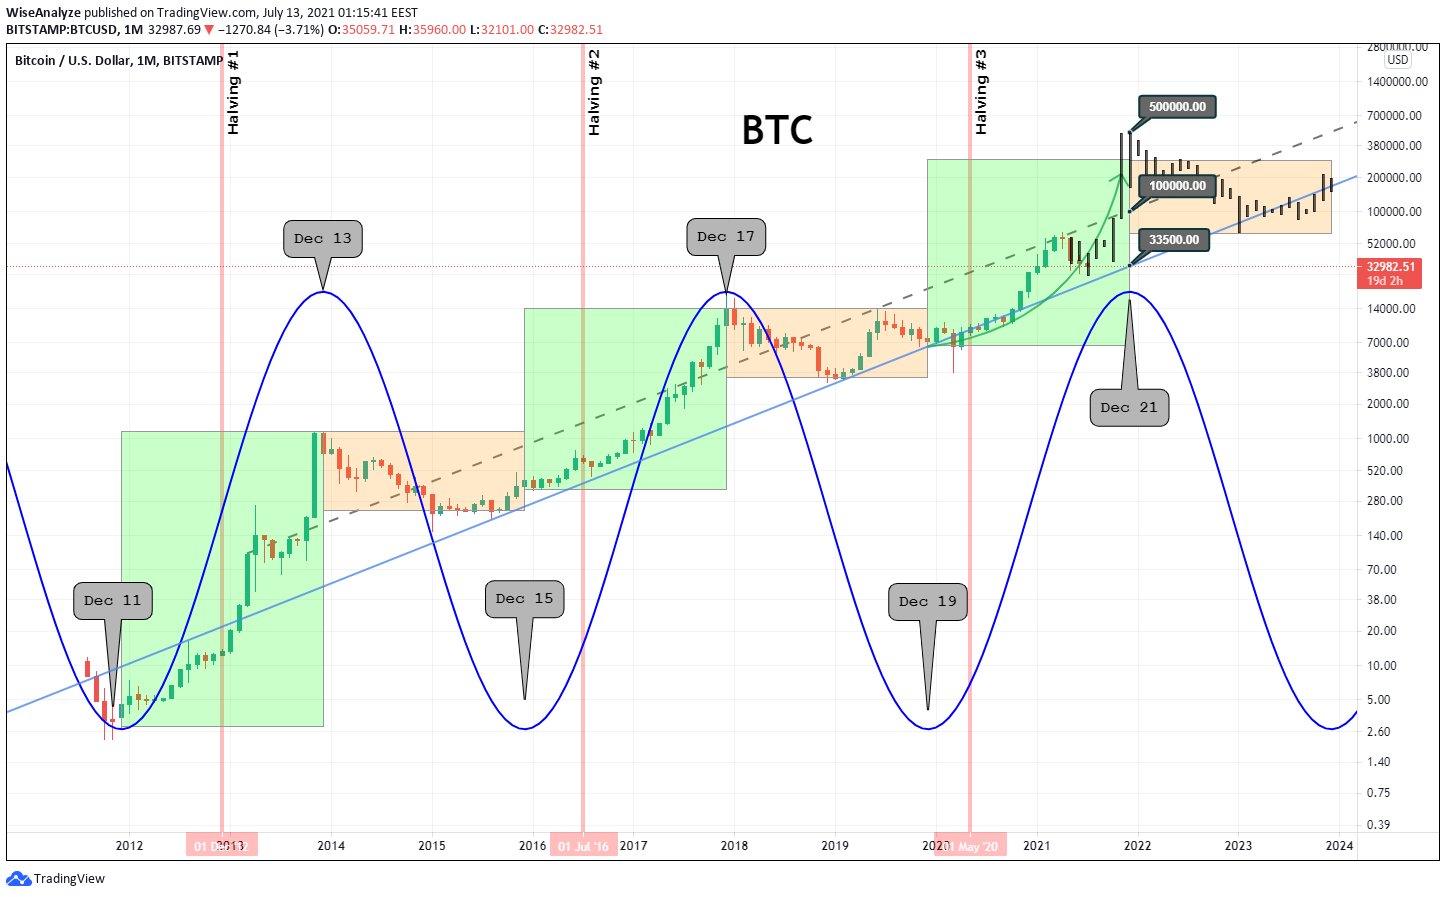
Bitcoin price is back above $50,000 and its return to the key resistance level has brought a potential bull market fractal back into focus. The bullish fractal in question suggests that another leg up in the crypto bull cycle is coming, matching the epic 2013 rally grand finale.
If the potentially repeating price pattern playing out similarly isn’t quite enough to convince, two separate technical indicators on monthly timeframes also appear to match the conditions that prompted one of the largest rallies in the cryptocurrency’s history.
Is A Clean Break Of $50K The Trigger To The Final Leg Up In Crypto?
Bitcoin price is back retesting $50,000 and while the level itself might be a clear phycological barrier due to the rounded price around halfway to most long-term targets, it also happens to be the median of the asset’s logarithmic growth curve.
The logarithmic growth channel has held the cryptocurrency within its boundaries for its entire existence, containing each bubble and supporting each bust.
If Bitcoin passes above the median, things could move quickly | Source: BLX on TradingView.com
Past bull market cycles have always concluded in the red zone, and the fact that the top cryptocurrency by market cap never made it there is the best argument for why a peak hasn’t yet occurred.
Related Reading | Weekly Bitcoin Momentum Cross Bullish For First Time Since March 2021
Whether or not the bull market has ended is heavily debated, but with Bitcoin back around $50,000 an answer should be near.
Past performance isn’t indicative of guaranteed future results, but beyond Bitcoin brushing up against the log channel median, there are also a number of other factors that match up almost perfectly.
Bitcoin Fractal Resembles 2013, Momentum And Relative Strength Also Similar
Comparing price action isn’t often enough to convince most analysts, especially if other market conditions are different. However, the conditions surrounding the 2013 final leg up and the current state of the 2021 cycle are also eerily similar.
During both rallies, Bitcoin paused after passing above the log median, fell back to the 1.618 golden ratio Fib extension level, and then made a successful attempt at touching the red upper boundary of the log channel.
The similarities between the two cycles are stacking | Source: BLX on TradingView.com
The Relative Strength Index on monthly timeframes also is behaving similarly, with Bitcoin just a few grand away from blasting back into bull market territory – a zone it spent very little time in comparative to the 2017 bull market.
The RSI making a double top with a lower high to form a bearish divergence would signal the end to the bull run.
Related Reading | Why An Ongoing Bullish Bitcoin “Retest” Might Result In New Highs
The LMACD, the log-based version of the MACD, a momentum tool, also is exhibiting a similar upward turn after a near crossover. Such a move is distinctly bullish, and often results in a powerful upside move.
The bullish conditions could propel Bitcoin price beyond the log channel median, and toward the red zone of the channel. Targets for the end of the cycle would be upwards of $125,000 based on the current location of the upper boundary, but as time progresses this peak gradually moves higher.
Markets are cyclical, and history often repeats. When it doesn’t, it still often rhymes. And while past performance doesn’t guarantee future results, according to Sir John Templeton, the four most expensive words in investing are “this time it’s different.”
Will Bitcoin blast off toward $125,000 and higher from here?
The similarities between #Bitcoin in 2013 and 2021 continue to grow. Peak will be in red. Currently around $125,000. I tend to think $144,000 when it’s all said and done. pic.twitter.com/4IU504uxPt
— Tony “The Bull” Spilotro (@tonyspilotroBTC) August 23, 2021
Follow @TonySpilotroBTC on Twitter or via the TonyTradesBTC Telegram. Content is educational and should not be considered investment advice.
Featured image from iStockPhoto, Charts from TradingView.com


